Shopify App : Windsor.ai
All your marketing and analytics data in one place.
About Windsor.ai
Integrate all your data : Connect your Shopify, media and analytics channels. Stream them into your BI platform or your data warehouse. Set up your data pipelines.
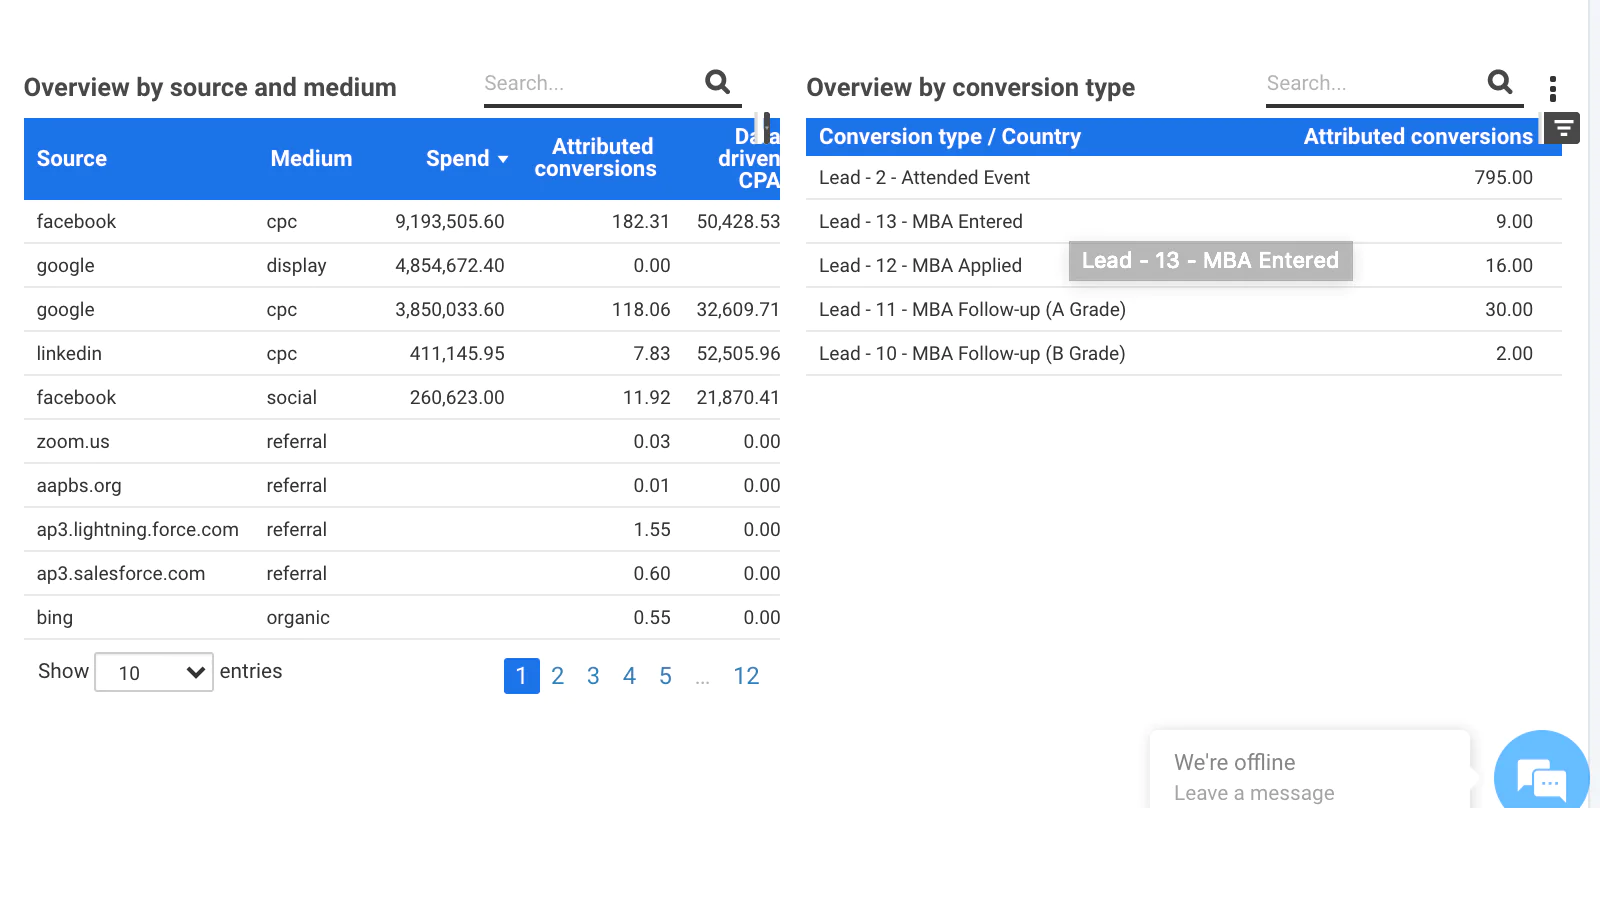
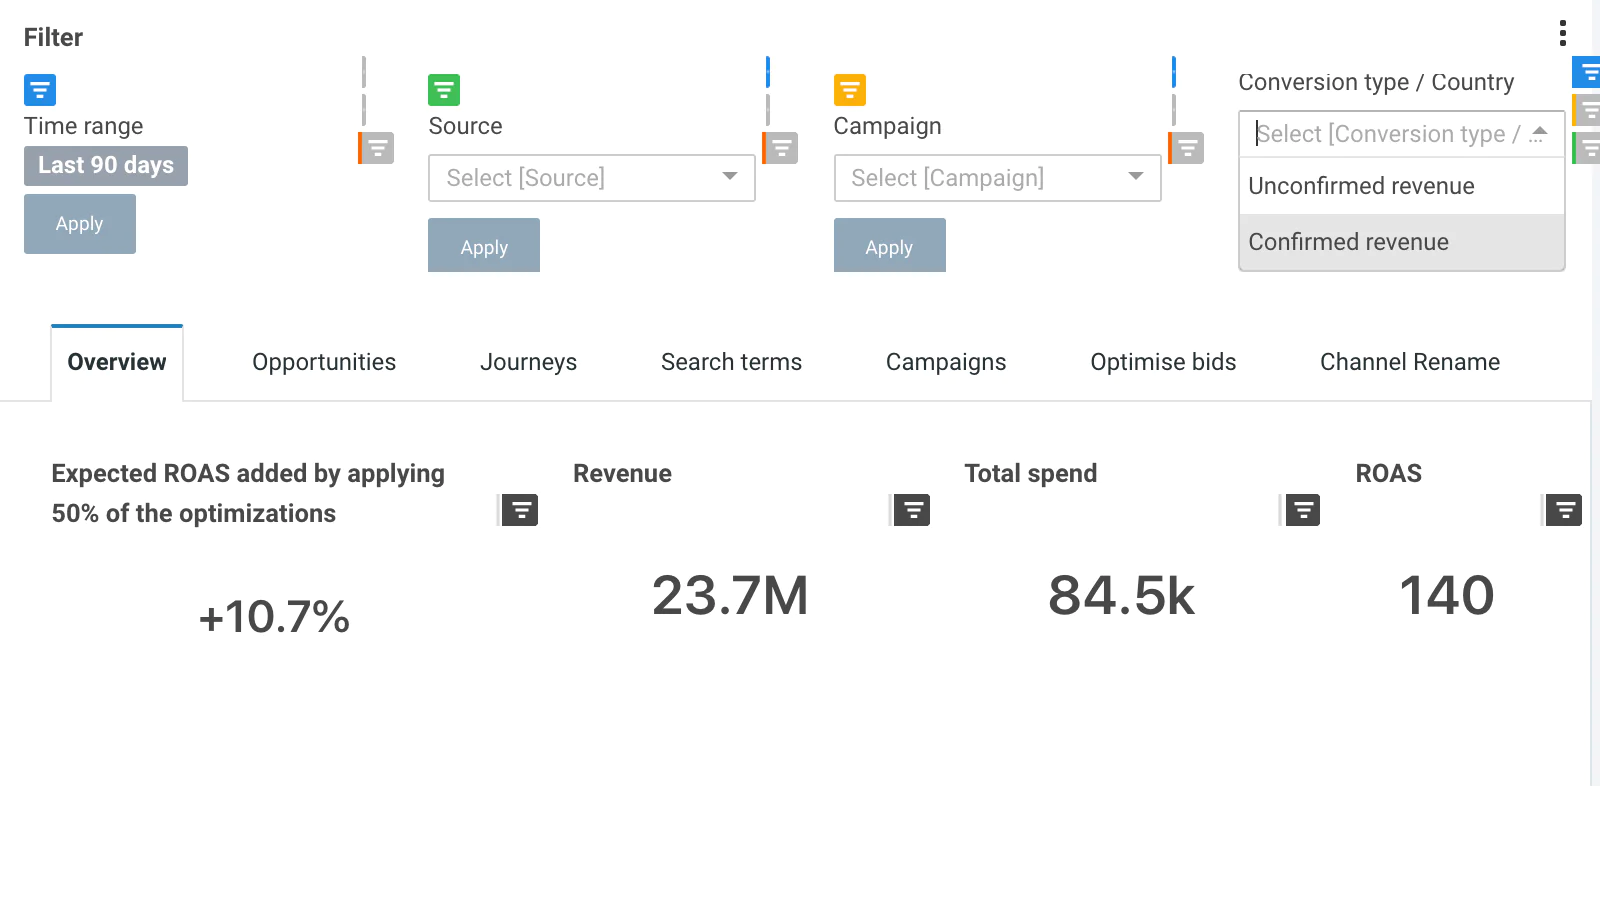
Net revenue/profit attribution : Connect your Shopify data to Google Analytics and your media data. Build your own net revenue/profit attribution model.
No more manual spreadsheets : Reduce manual time spent on copy/pasting data from different platforms. Set up automated data pipelines in minutes.

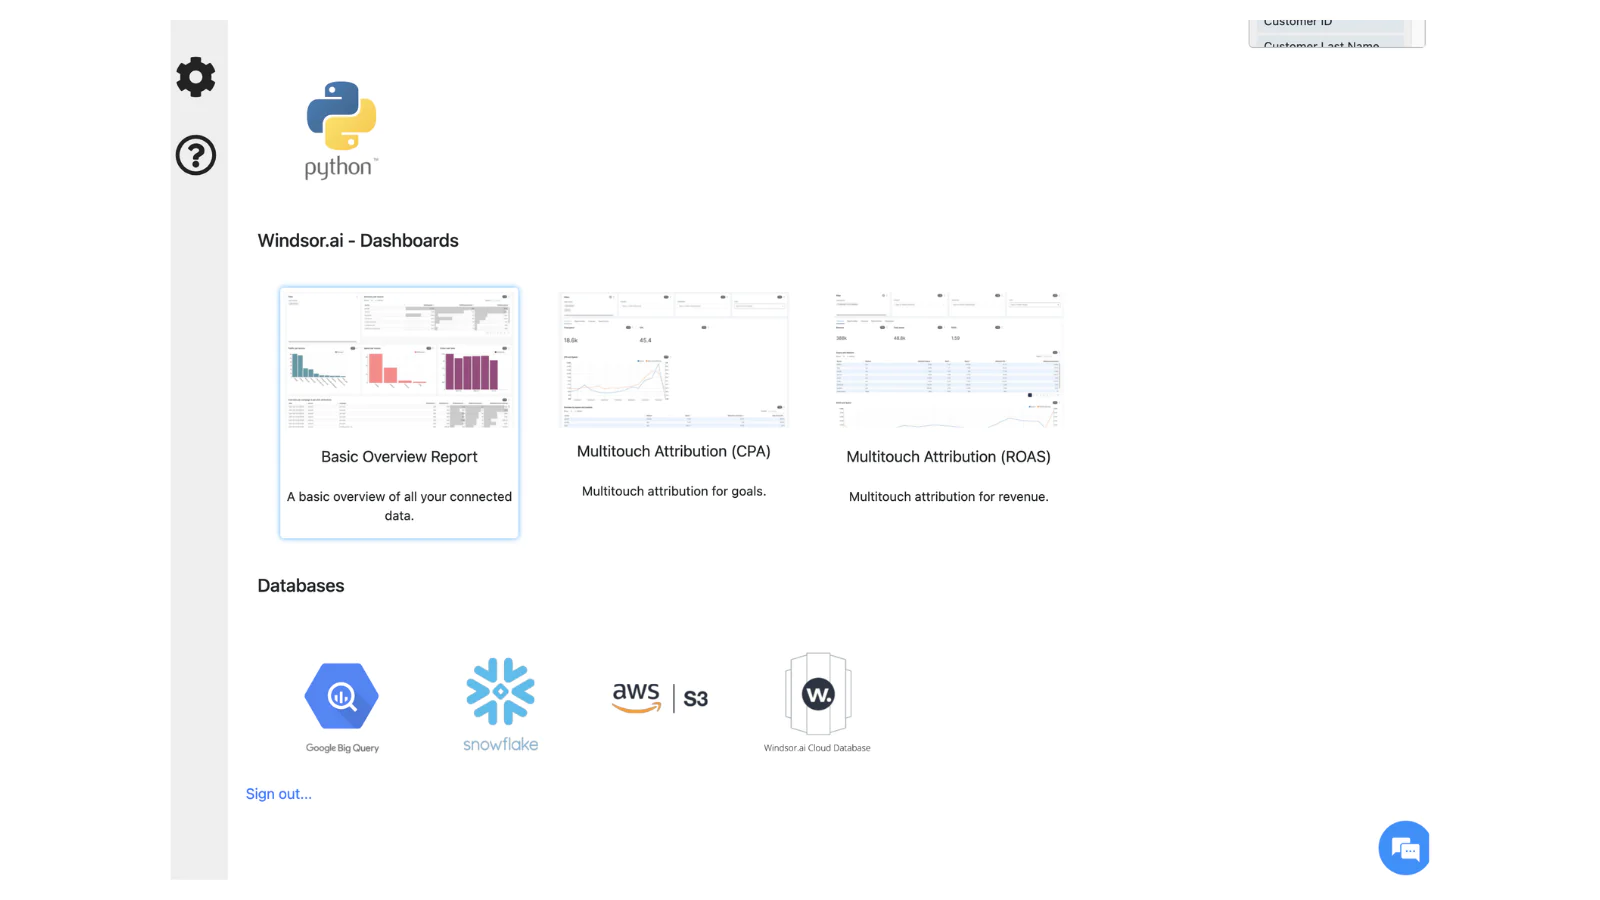
Connect all your marketing and analytics data into one place
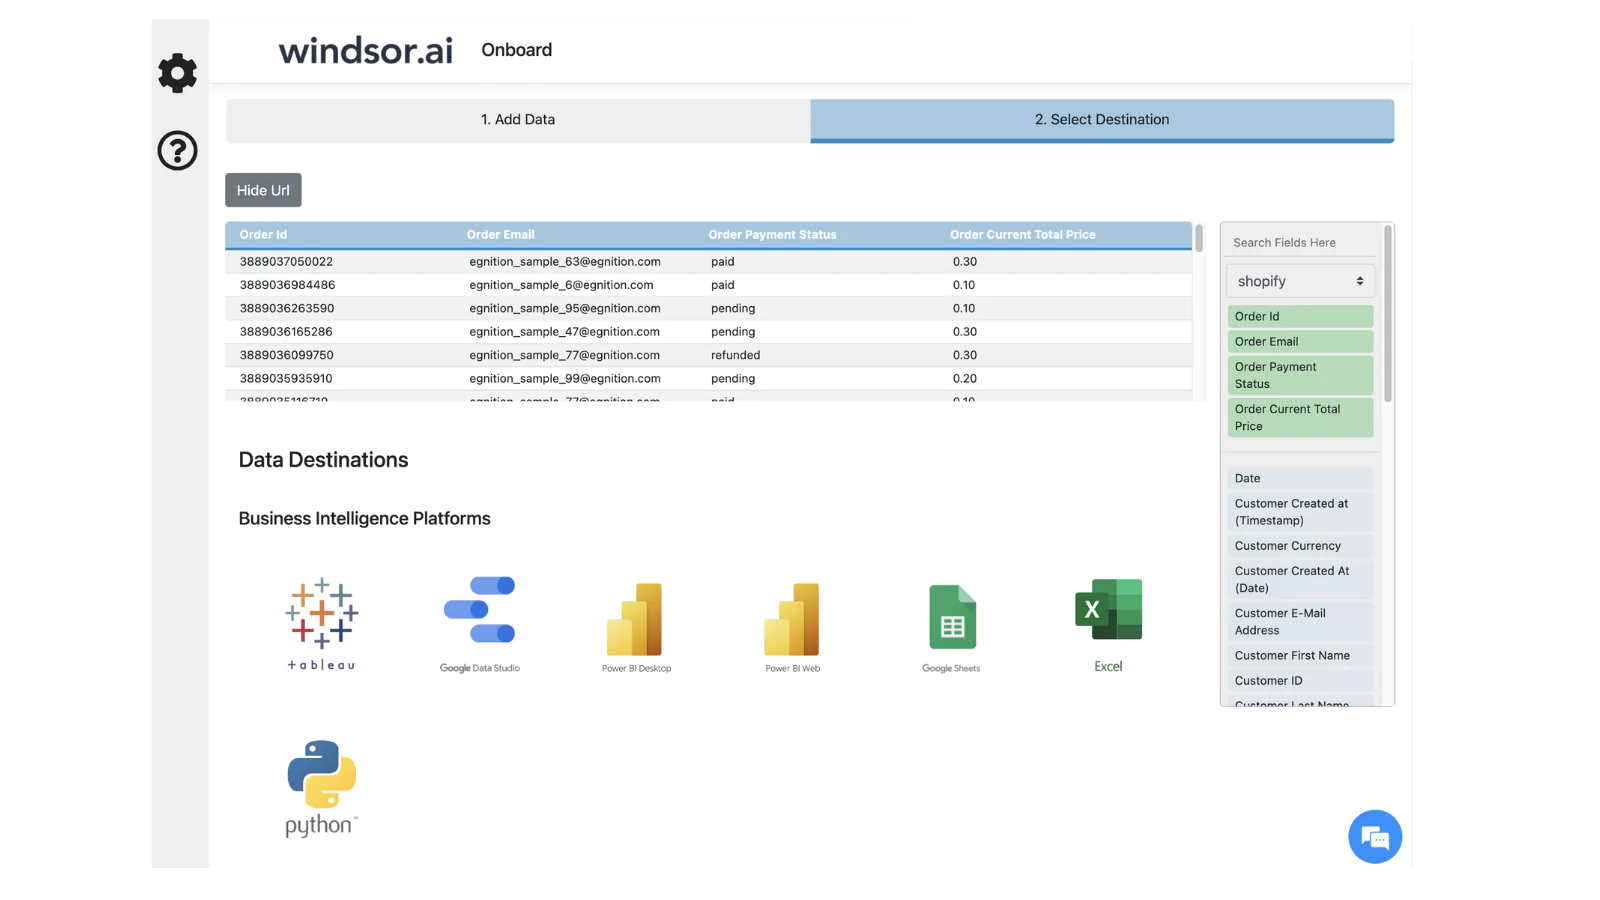
- Visualize Shopify (purchases, products, ..) data in any dashboarding tool like Power BI, Data Studio, Tableau or Google Sheets.
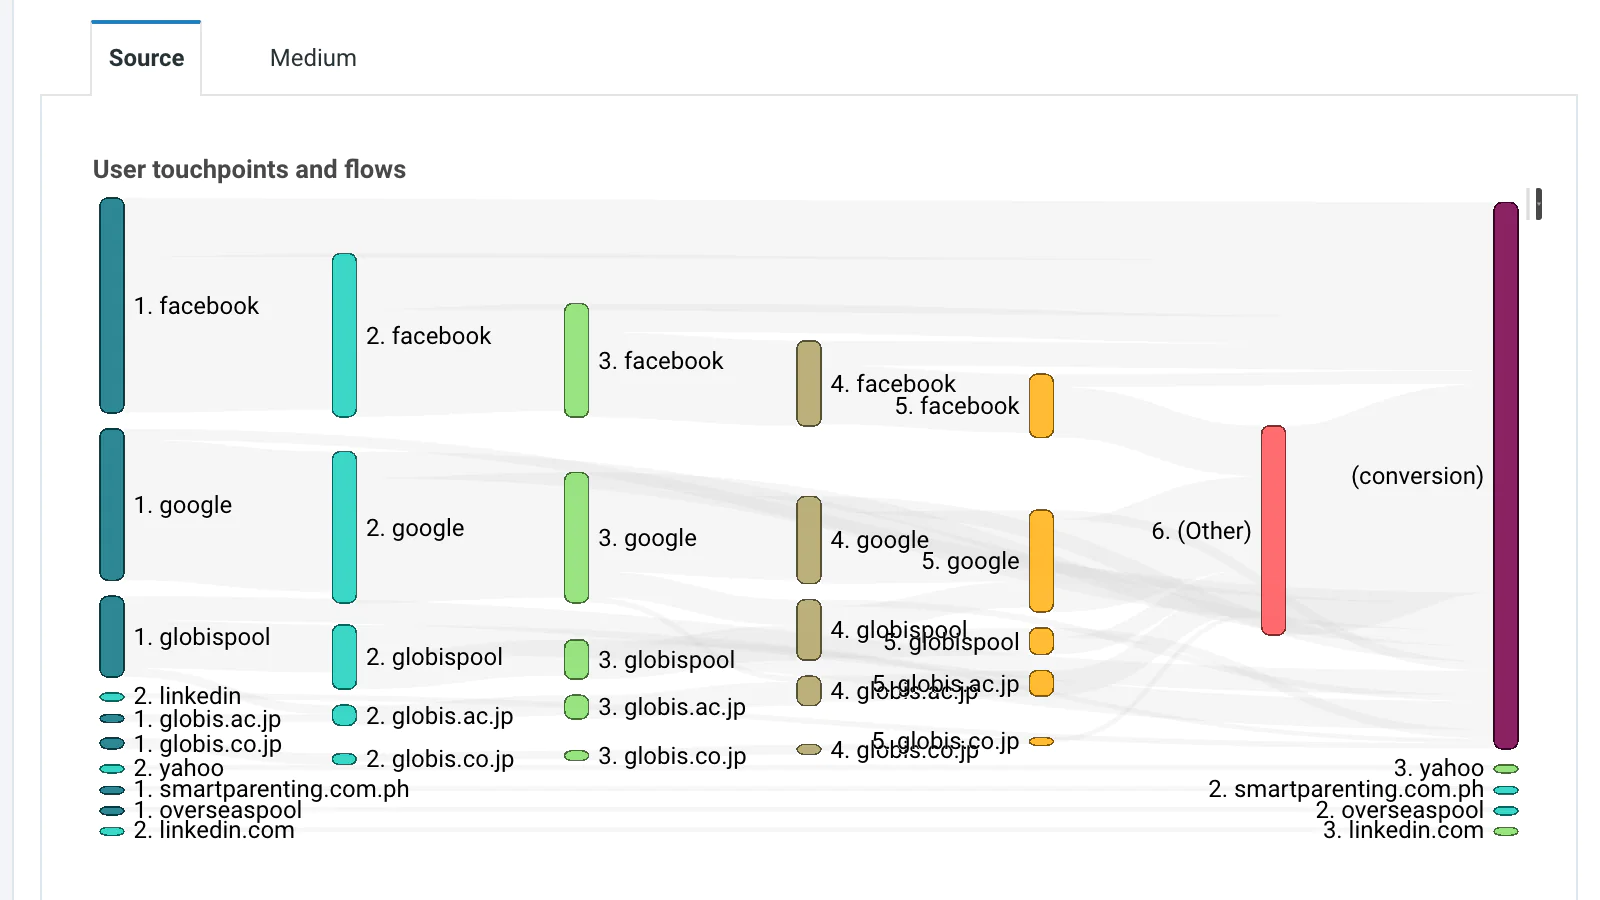
- Join the data from Shopify and Google Analytics on transaction id dimension. This join helps advertisers to understand the net revenue impact of their performance marketing activities (Google Analytics does not remove revenue if e.g. an order is cancelled).
- Stream your Shopify data to your data warehouse like Google BigQuery, Snowflake, Amazon S3.
Speed tested: no impact to your online store
Preparing your Google Analytics 4 Account for Multitouch Attribution
[2023/03/07 07:31:04]
Hello! Today, I’ll explain the steps you need to take in your Google Analytics 4 (GA4) account to prepare for attribution in Windsor AI. Preparing for attribution involves two steps: Add a client_id for users on the Google Tag Manager (GTM) side. Add custom dimensions. Before you get started, make sure you have set up… Read More »Preparing your Google Analytics 4 Account for Multitouch Attribution The post Preparing your Google Analytics 4 Account for Multitouch Attribution appeared first on Data and Marketing Attribution Modelling | Windsor.ai.
Power BI vs Google Data Studio in 2023: Which is better?
[2023/03/02 11:34:09]
Power BI and Google Data Studio are among the leaders in data visualization tools. Both tools have their strengths and weaknesses, so it is important to consider the user’s specific needs before making a decision. Power BI vs Google Data Studio comparison will allow you to select the right tool as per your business requirements.… Read More »Power BI vs Google Data Studio in 2023: Which is better? The post Power BI vs Google Data Studio in 2023: Which is better? appeared first on Data and Marketing Attribution Modelling | Windsor.ai.
Salesforce Marketing Cloud connection guide
[2023/02/15 08:56:44]
Follow this guide to connect your Salesforce Marketing Cloud data to Windsor.ai. The process has several steps — follow the instructions carefully, and let us know if you need any help. Before you begin To connect, you need: A Pro, Corporate, or Enterprise edition Salesforce Marketing Cloud account A Salesforce Marketing Cloud account with… Read More »Salesforce Marketing Cloud connection guide The post Salesforce Marketing Cloud connection guide appeared first on Data and Marketing Attribution Modelling | Windsor.ai.
LinkedIn Ads report building guide
[2023/02/14 12:52:06]
The post LinkedIn Ads report building guide appeared first on Data and Marketing Attribution Modelling | Windsor.ai.
How to connect Google Search Console to Google Data Studio? [The Complete 2023 Guide]
[2023/02/07 10:01:24]
Adding the data from Google Search Console to Looker Studio lets you share, embed, and email your reports to teammates and clients. Our Google Search console connector has more than 50 fields and metrics, with the main fields being clicks, impressions, site CTR, and Average Position. With these metrics, you can strategize better and improve your business. This post teaches you to create a simple Looker Studio… Read More »How to connect Google Search Console to Google Data Studio? [The Complete 2023 Guide] The post How to connect Google Search Console to Google Data Studio? [The Complete 2023 Guide] appeared first on Data and Marketing Attribution Modelling | Windsor.ai.
How to connect Klaviyo to Google Data Studio? [The Complete 2023 Guide]
[2023/02/07 09:49:57]
Email marketing is one strategy that can help business owners get loyal customers, and Klaviyo is a popular email marketing tool that enables you to connect with your customers. It also supplies you with marketing data to optimize your marketing effort. To get the most out of the marketing data, you need to connect… Read More »How to connect Klaviyo to Google Data Studio? [The Complete 2023 Guide] The post How to connect Klaviyo to Google Data Studio? [The Complete 2023 Guide] appeared first on Data and Marketing Attribution Modelling | Windsor.ai.
Microsoft Power BI Facebook Ads Report Dashboard Template
[2023/01/24 11:22:51]
The post Microsoft Power BI Facebook Ads Report Dashboard Template appeared first on Data and Marketing Attribution Modelling | Windsor.ai.
Rakuten connection guide
[2023/01/24 09:11:52]
Use this guide to connect your Rakuten data to windsor.ai. Before you begin Windsor.ai fetches performance data for affiliate campaign advertisers through Rakuten Advertising. It doesn’t currently support the platform’s publisher side. To connect to Rakuten, you need to create a report, and then get your report key and API token. Follow the steps below… Read More »Rakuten connection guide The post Rakuten connection guide appeared first on Data and Marketing Attribution Modelling | Windsor.ai.
Tableau TikTok Ads Dashboard Template
[2023/01/18 08:39:29]
This Tableau TikTok Ads Dashboard template allows you to visualize in Tableau the performance of your TikTok Ads campaigns in a few clicks, through our dedicated Tableau Web Data Connector for TikTok Ads. Dimensions and metrics visualized in this report: Cost (how much you’re spending on TikTok Ads) CPM (Cost per 1000 Impressions) Impressions (how… Read More »Tableau TikTok Ads Dashboard Template The post Tableau TikTok Ads Dashboard Template appeared first on Data and Marketing Attribution Modelling | Windsor.ai.
Tableau Google Display & Video 360 (DV360) Dashboard Template
[2023/01/18 08:25:56]
This Tableau Google Display and Video 360 Dashboard template allows you to visualize in Tableau your Google DV 360 performance in a few clicks, through our dedicated Tableau Web Data Connector for Google DV 360. Dimensions and metrics visualized in this report: Cost (how much you’re spending) CPM (Cost per 1000 Impressions) Impressions Clicks CTR… Read More »Tableau Google Display & Video 360 (DV360) Dashboard Template The post Tableau Google Display & Video 360 (DV360) Dashboard Template appeared first on Data and Marketing Attribution Modelling | Windsor.ai.
About the Author
Matej Kontros is an E-Commerce expert and app developer with over a decade of professional experience in IT.
Matej has worked for organisations of all types and sizes, including global players, startups, and agencies. He designed, developed, and maintained complex projects.
Matej's expertise includes e-commerce, software engineering, web development, systems administration, internet security, managing projects, and building teams.
Visit his website at [ Web Linkedin ] or contact him at [email protected].