Shopify App : Ecommerce Analytics
Actionable ecommerce performance analytics to grow faster
About Ecommerce Analytics
Ditch Your Reports : End the pain of hours spent analyzing sales across multiple channels. See exactly where you’re making money and where you need to pivot.
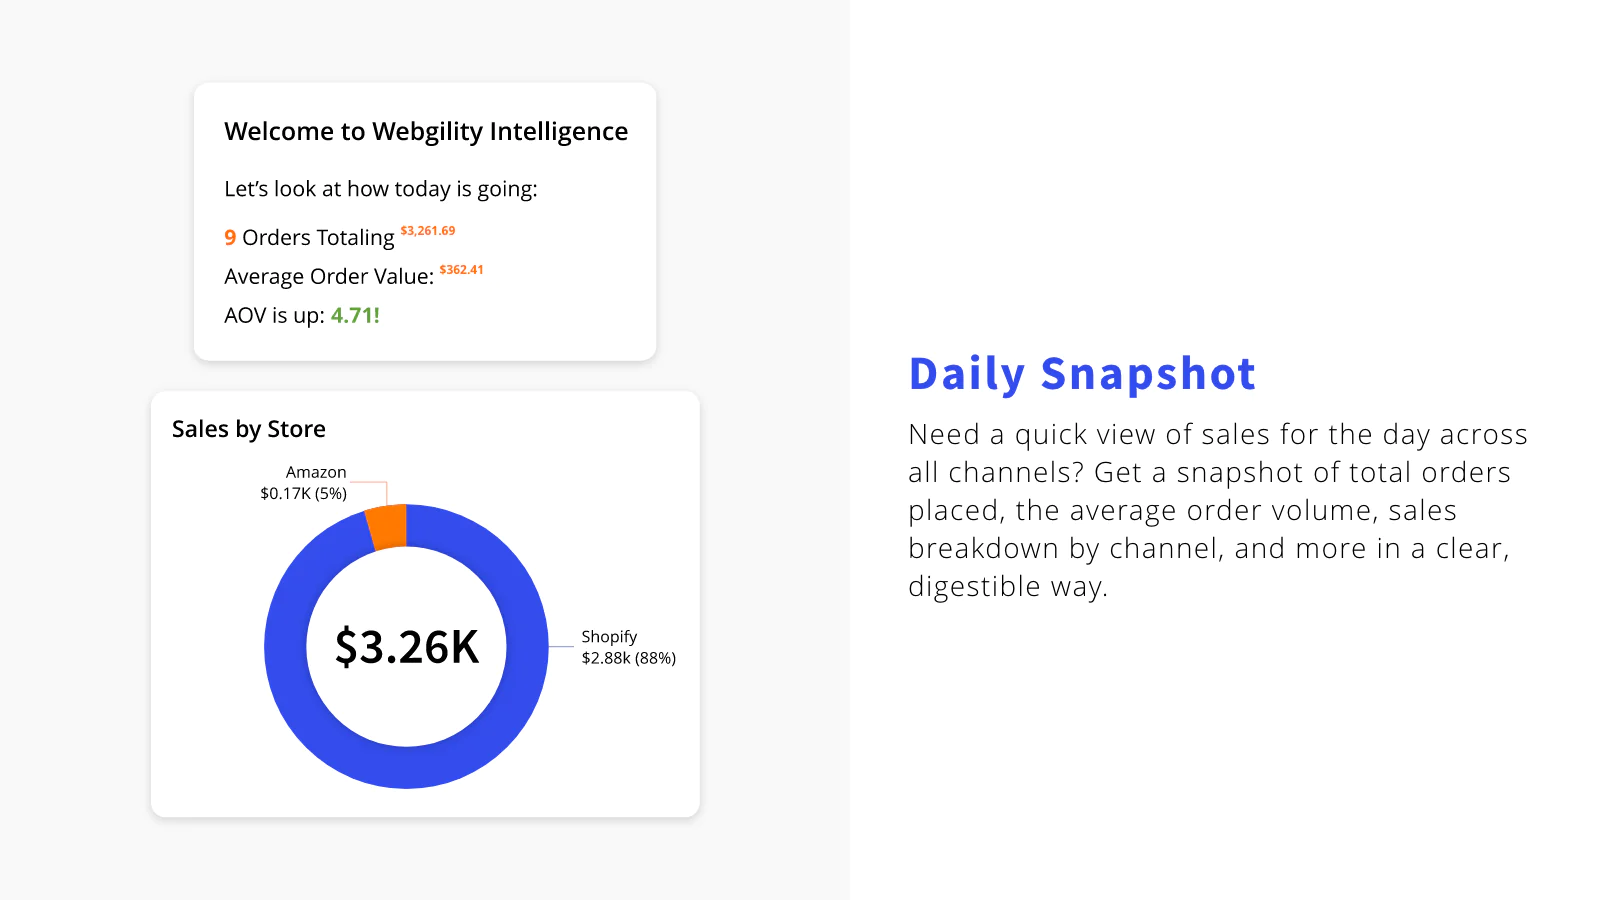
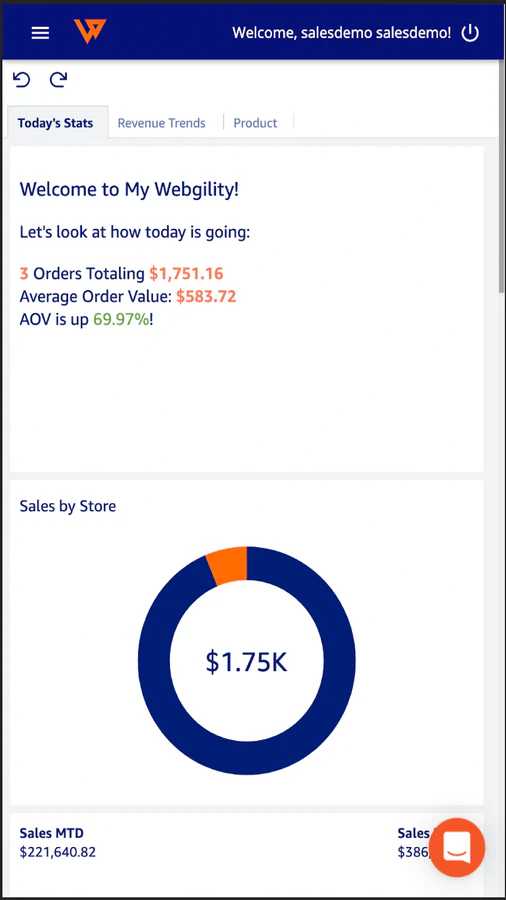
Keep Tabs on Sales : Get a snapshot of daily sales, including total orders, average order volume, sales by channel, and more in a clear, digestible way.
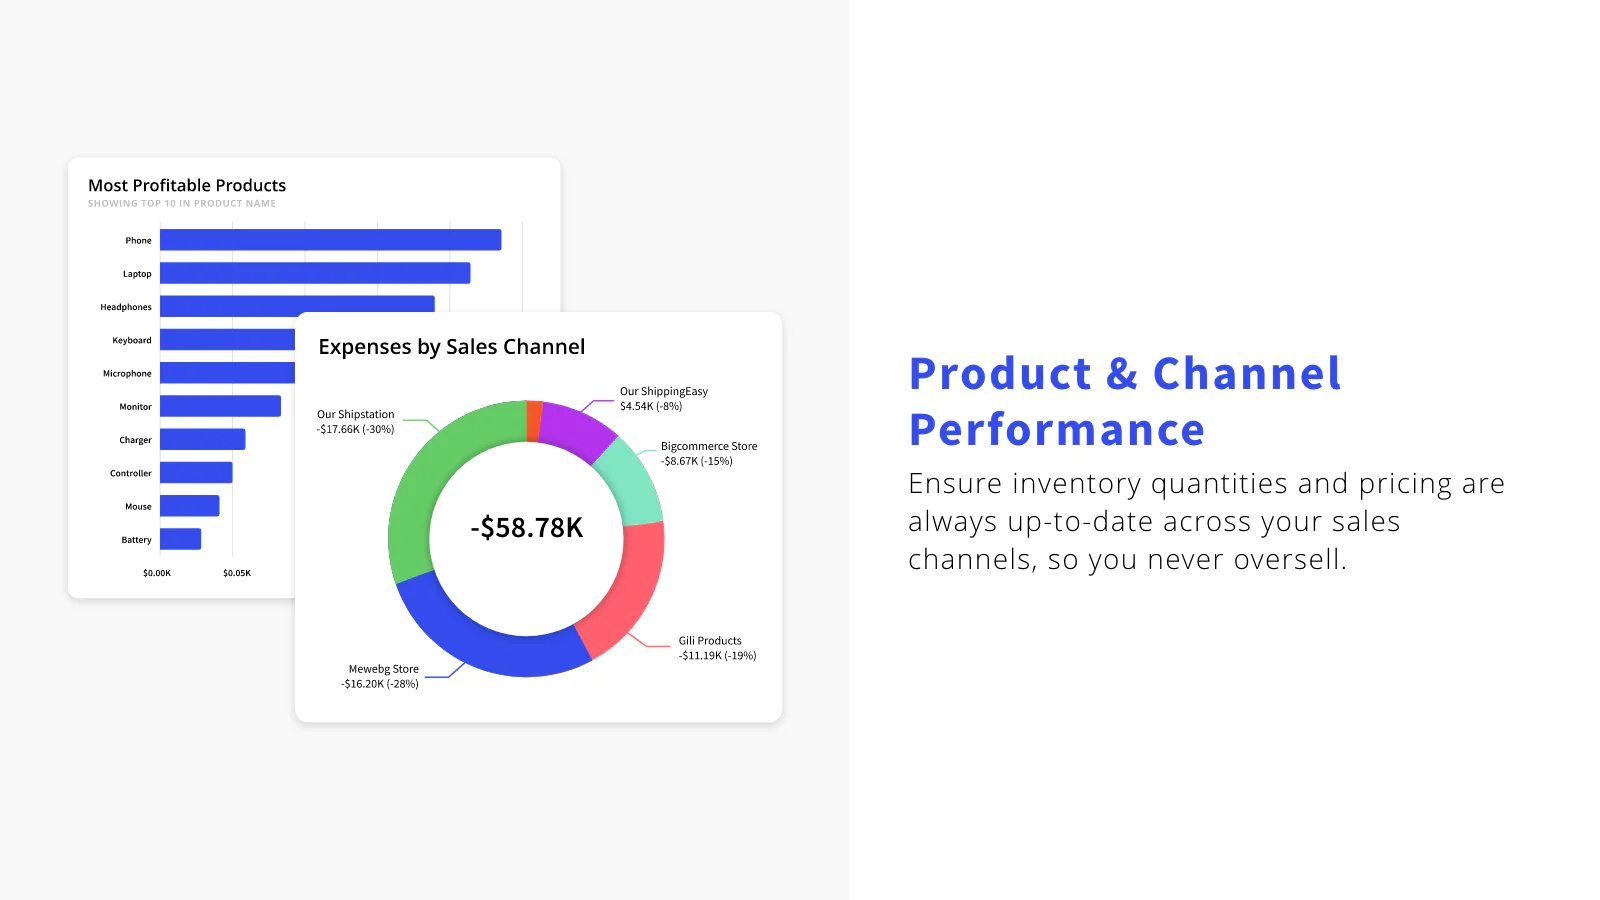
Make More Money : Assess the performance of all your sales channels and product lines, so you can see where you’re selling best and where you need to pivot.
Webgility Intelligence automatically captures data from all your sales channels and marketplaces then turns that data into actionable insights that help you re-allocate spend, promote or retire product lines, and expand or consolidate channels to keep your business thriving.
With Webgility Intelligence, You Can:
Keep tabs on sales. Need a quick view of sales for the day across all channels? Get a snapshot of total orders placed, the average order volume, sales breakdown by channel, and more in a clear, digestible way.
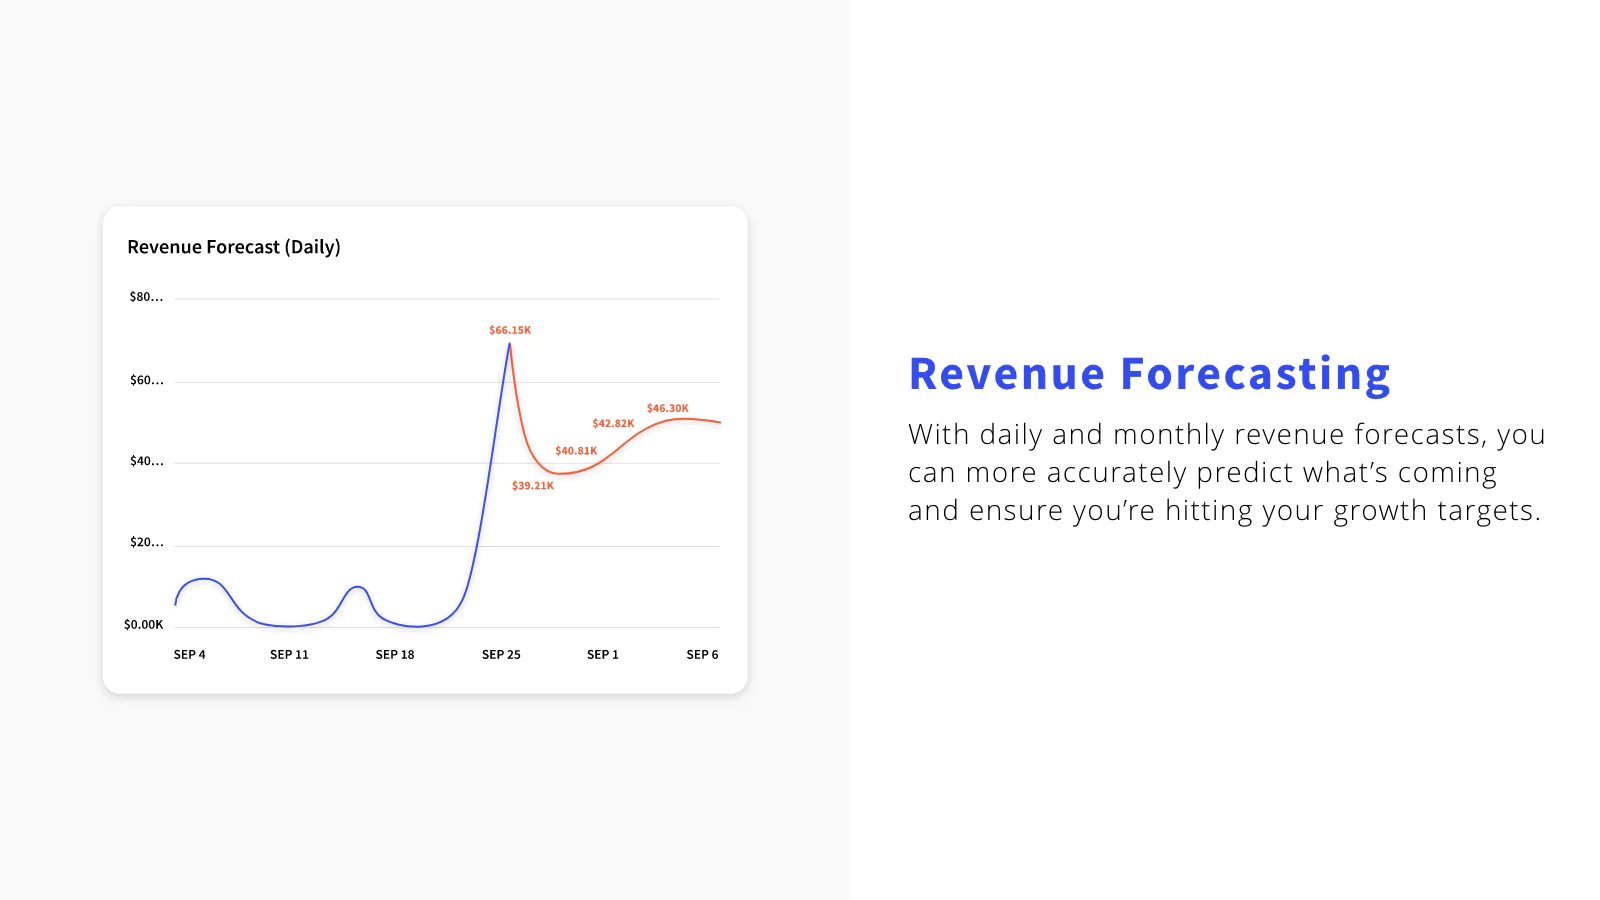
Hit your growth targets. With daily and monthly revenue forecasts, you can more accurately predict what’s coming and ensure you’re hitting your growth targets.
Pinpoint your moneymakers. Quickly assess the performance of all your sales channels and product lines, so you can see where you’re selling best and where you need to pivot.
Stay in the know from anywhere. Keep an eye on your business, no matter where you are, with access to profitability and performance metrics from the convenience of your browser or smartphone.
How it Works
- Click ‘Add App’ above and enter your Shopify URL.
- You’ll then be taken to the Webgility Connection’s Manager where you will be guided through adding your additional stores.
- That’s it! Simply click on the Sales Dashboard and begin consuming valuable insights to help grow your business.
Questions You Can Answer with Webgility Intelligence:
What is my average order volume for the day?
What do my sales look like by channel for the day?
How am I tracking to my daily sales goal?
What are my top products sold today?
What is my revenue forecast for the day and month?
What are my product quantities sold by week?
What are my best increases in product sales?
Insights & Charts Included
Today’s Stats: – Total Orders/Average Order Volume – Sales By Store – Period over Period – Daily Sales Goal
Revenue Trends: – Revenue Forecast – Weekly Sales by Channel – Revenue vs. Orders – Revenue vs. Discounts – Revenue vs. Tax – Revenue vs. Shipping – Average Order Value – Order Total vs. Running Total
Product Performance: – Product Quantities Sold by Week – Product Sales in This Date Range – Best Increases in Product Sales This Date Range – Greatest Declines in Product Sales This Date Range – Discounts & Coupons Used in This Date Range
About the Author
Matej Kontros is an E-Commerce expert and app developer with over a decade of professional experience in IT.
Matej has worked for organisations of all types and sizes, including global players, startups, and agencies. He designed, developed, and maintained complex projects.
Matej's expertise includes e-commerce, software engineering, web development, systems administration, internet security, managing projects, and building teams.
Visit his website at [ Web Linkedin ] or contact him at [email protected].